10주 2일차 TIL 정리

10주 2일차에는 분석목표를 설정하여 SQL문을 작성하는 수업을 주로 진행했다.
※ PostgreSQL을 Tableau에 연결하기 ※
수업 시작 전 PostgreSQL을 태블로 서버에 연결하는 법에 대해 수강생들끼리 알아보았다.
1. 태블로의 연결 화면에서 서버에 연결 - 자세히 - PostgreSQL을 선택해준다.

2. 드라이버가 없다면 경고창이 뜨는데, 해당 링크를 통해 .jar 파일을 다운받을 수 있다.

3. 해당 파일을 받았다면 (윈도우 기준) C:\Program Files\Tableau\Drivers 로 위치를 옮겨준다.
4. 태블로를 재시작해 1번과 같이 누르면 다음과 같이 창이 뜬다.

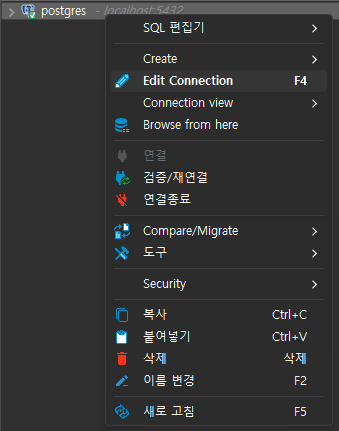
5. 여기서 PostgreSQL을 실행하고 있는 편집프로그램으로 들어간다. (예시의 경우 DBeaver)
여기서 Postgres를 우클릭 후 연결 편집으로 들어가준다.

이와 같이 정보가 뜨는데, 이 정보를 보며 4번의 빈칸을 채워넣으면 된다.

6. 다음과 같이 채워넣으면 정상적으로 서버에 연결할 수 있다.

※ 함수 학습 ※
1. coalesce(A,B,C)
- 전부 not null이면 A 반환, A가 null이면 B 반환, A와 B가 null이면 C 반환
- PostgreSQL에선 ifnull(A,0) 사용하지 않고 coalesce(A,0)사용
* postgreSQL에선 nullif가 있다.
select nullif(name, 'no data')
→ name컬럼에서 no data라는 항목을 null값으로 처리
select coalesce(address,'') || ' ' || coalesce(city,'') || ' '
    || coalesce(region,'') || ' ' || coalesce(postal_code,'') || ' '
    || coalesce(country,'') as concatted_addr
from northwind.customers c
= (띄어쓰기 없을 경우)
select concat(address, city, region, postal_code, country)
from northwind.customers c
2. 날짜 함수
-- 현재의 timestamp과 타임존을 함께 표시
select now();
select current_timestamp;
-- 로컬 timestamp 표시
select localtimestamp;
-- 현재 date 표시
select current_date;
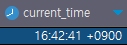
-- 현재 time과 타임존을 함께 표시
select current_time;
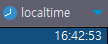
-- 현재 로컬 time 표시
select localtime;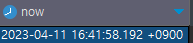


- extract, date_part : 현재 데이터에서 특정 하나만 추출(year, month 등)
select extract('year' from now())

select date_part('year', now())
(integer형 리턴)
- to_char: char형으로 원하는 날짜형식 출력
select to_char(now(),'yyyy-mm-dd HH24:mm:ss');
* 다양한 방법으로 요일 추출하기
select extract ('dow' from cast('2023-04-09' as date));   -- int
select date_part('dow',cast('2023-04-09' as date));       -- int
select to_char(cast('2023-04-09'as date),'day');          -- char


3. 자료형 변환
- 자료형 변환(표준): cast(변환대상 as 자료형)
- 자료형 변환(postgre): 변환대상::자료형
select cast(now() as date);
select now()::date;
select cast(now() as time);
select now()::time;
※ 샘플데이터 ※
샘플데이터 - northwind
식품을 수출하는 가상의 회사


데이터 파악 단계에서 B2B거래를 하는 회사이며, 공급사로부터 선지급받은 후 배송사를 이용, 고객사로 배송을 하거나 공급사에서 배송사를 통해 직접 고객사로 배송하는 형태로 사업이 운영됨을 알 수 있었다.
1. 월별 매출
-- 월별 매출액
select to_char(o.order_date,'yyyy-mm')
       ,sum(od.unit_price * od.quantity * (1-od.discount)) as monthly_sales
from northwind.orders o , northwind.order_details od
where o.order_id = od.order_id
group by 1
order by 1;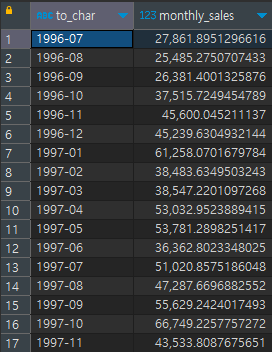
2. 월별 매출액, 구매건수, 구매자수
-- 월별 매출액, 주문 수, 구매자 수
select to_char(o.order_date,'yyyy-mm')
       ,sum(od.unit_price * od.quantity * (1-od.discount)) as monthly_sales
       ,count(distinct o.order_id)
       ,count(distinct o.customer_id)
from northwind.orders o , northwind.order_details od
where o.order_id = od.order_id
group by 1
order by 1;
3. 월별 인당 평균 매출액, 건당 평균 구매액
-- 월별 인당 평균 매출액, 건당 평균 구매액
select to_char(o.order_date,'yyyy-mm')
       ,sum(od.unit_price * od.quantity * (1-od.discount)) / count(distinct o.customer_id) as "인당 평균 구매액"
       ,sum(od.unit_price * od.quantity * (1-od.discount)) / count(distinct o.order_id) as "건당 평균 구매액"
from northwind.orders o , northwind.order_details od
where o.order_id = od.order_id
group by 1
order by 1;
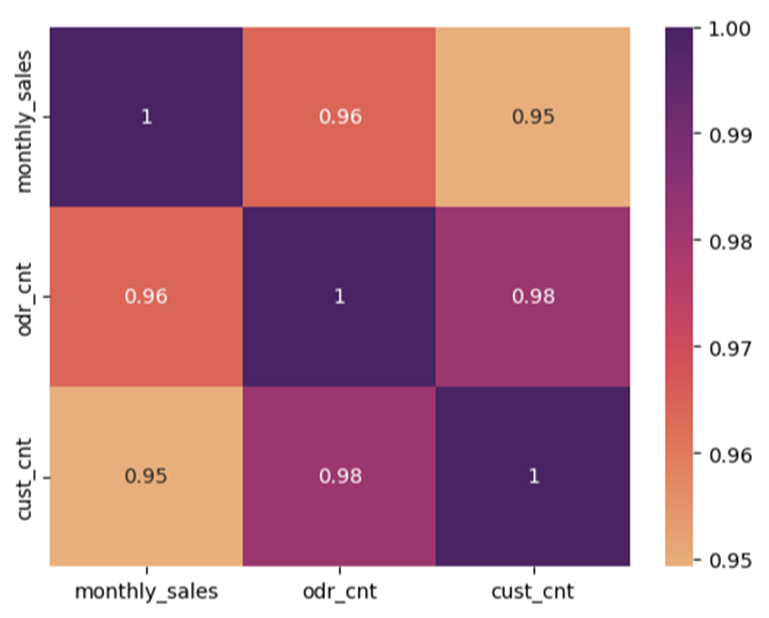
4. 월별 매출 - 주문횟수 그래프, 월별 매출 - 주문고객수 그래프 및 상관관계 히트맵


5. 분기별 매출 - 주문횟수 그래프, 분기별 매출 - 주문고객수 그래프 및 상관관계 히트맵
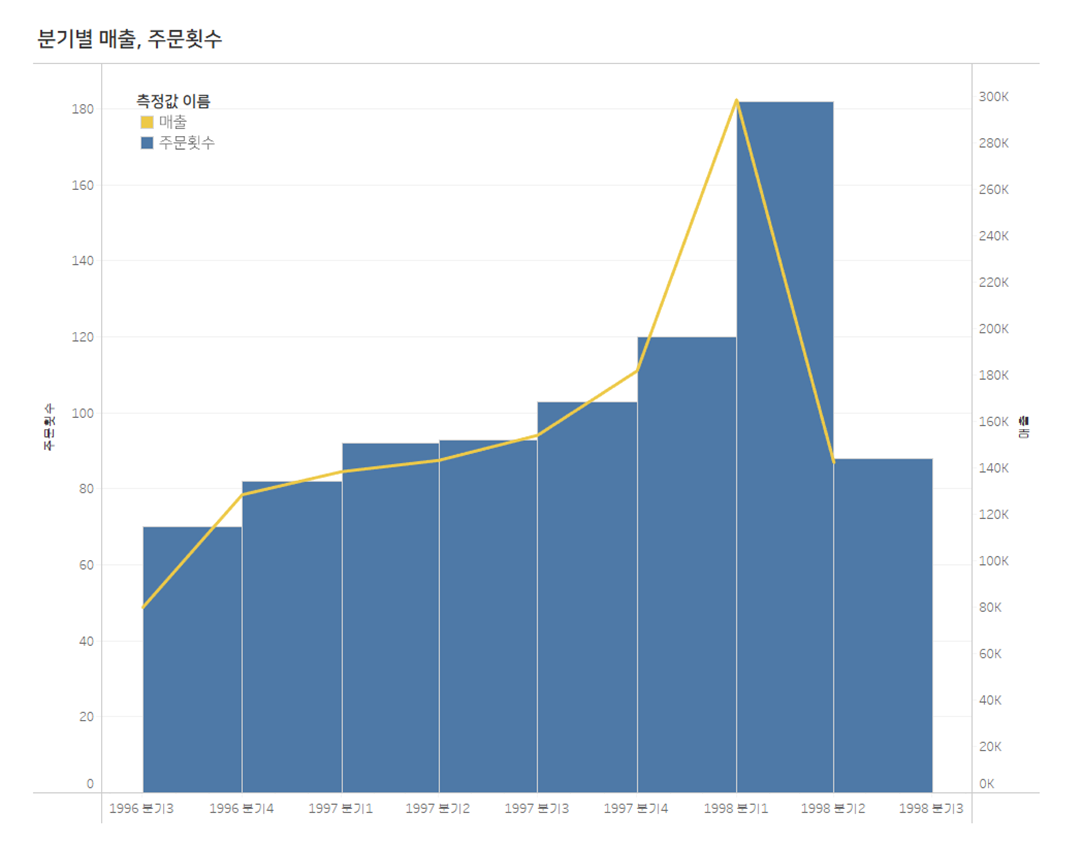


6. 결론
월별, 분기별로 파악했을 때 매출은 주문 고객수보다는 주문횟수에 비례해 증가한다.
※ python에서 쿼리를 데이터프레임으로 만들기 ※
query = """
select to_char(o.order_date,'yyyy-mm')
       ,sum(od.unit_price * od.quantity * (1-od.discount)) as monthly_sales
       ,count(distinct o.order_id) as odr_cnt
       ,count(distinct o.customer_id) as cust_cnt
from northwind.orders o , northwind.order_details od
where o.order_id = od.order_id
group by 1
order by 1;
"""
df = pd.read_sql_query(sql=query, con=postgres_engine)
df.head()
query = """ 쿼리 이 안에다가 입력 """
* 주의사항: 이때 from절에서 테이블을 언급하려면 스키마명을 써줘야 한다.
eg) from Book (x)
from Bookstore.Book(o)